

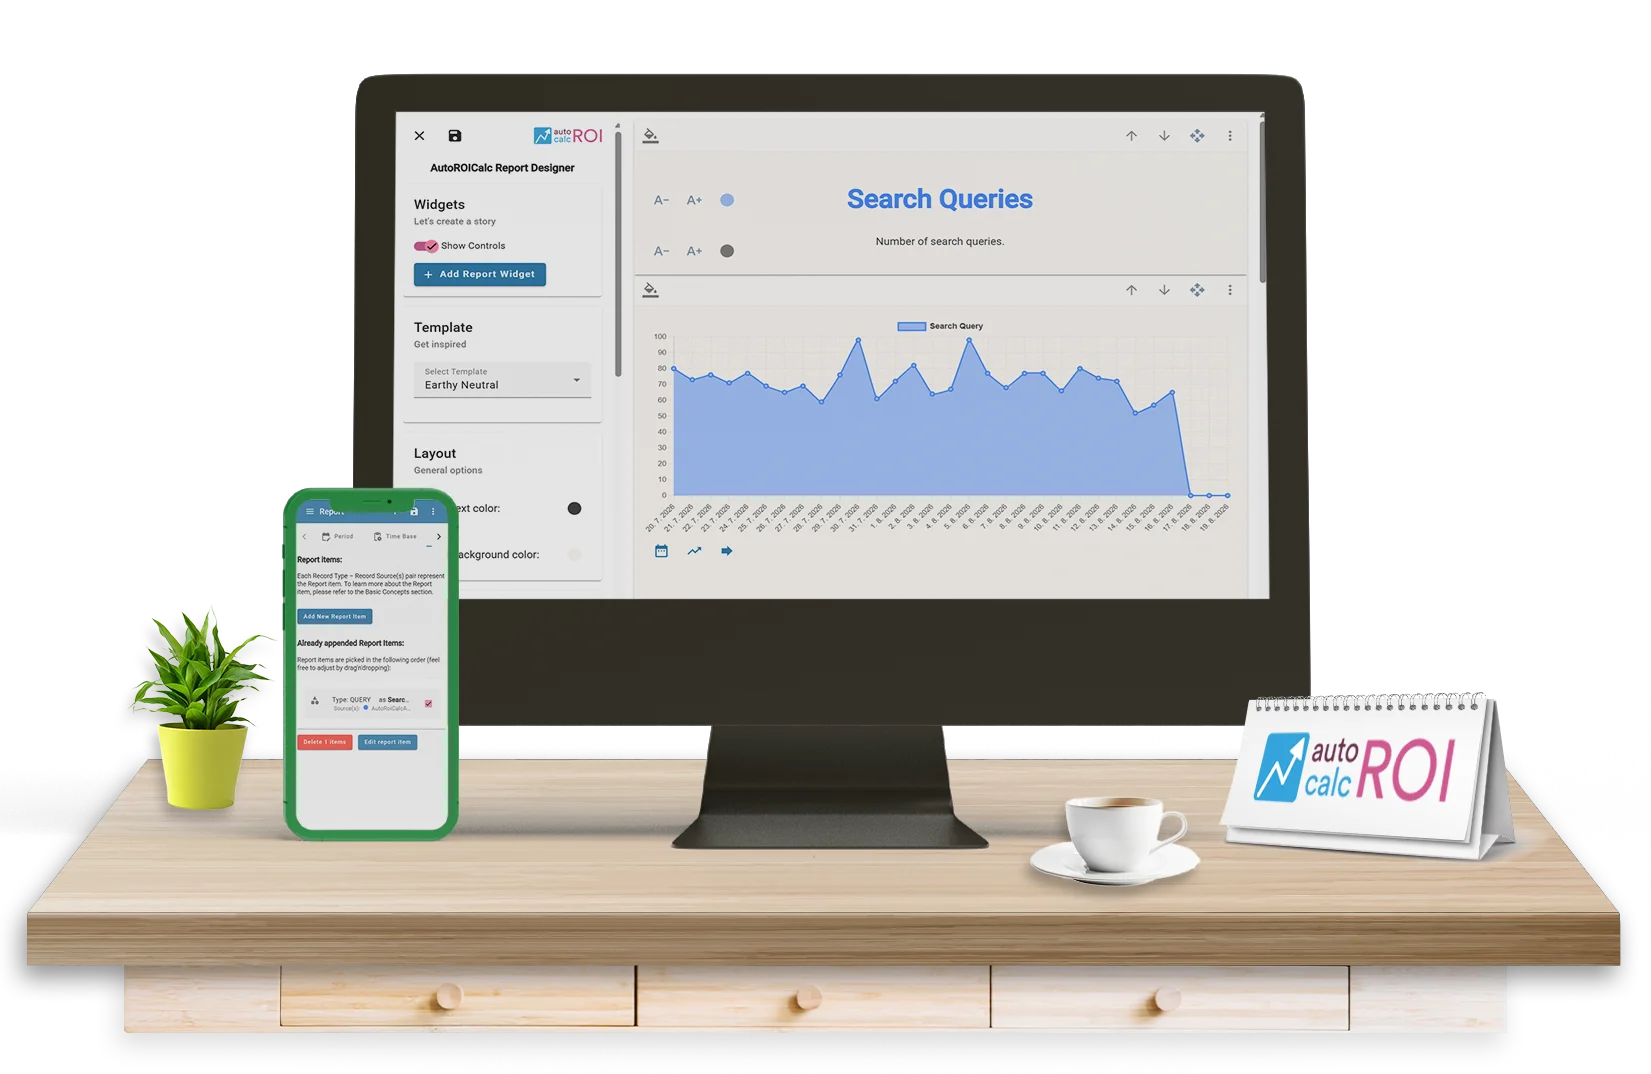
Build SEO reports your way
With custom sections, charts, data tables, KPI values, filters, goals, and dashboard widgets.
No More One-Size-Fits-All SEO Reports
Different clients and teams care about different results. AutoROICalc lets you build custom reports around the metrics, filters, widgets, and explanations that fit your reporting workflow.
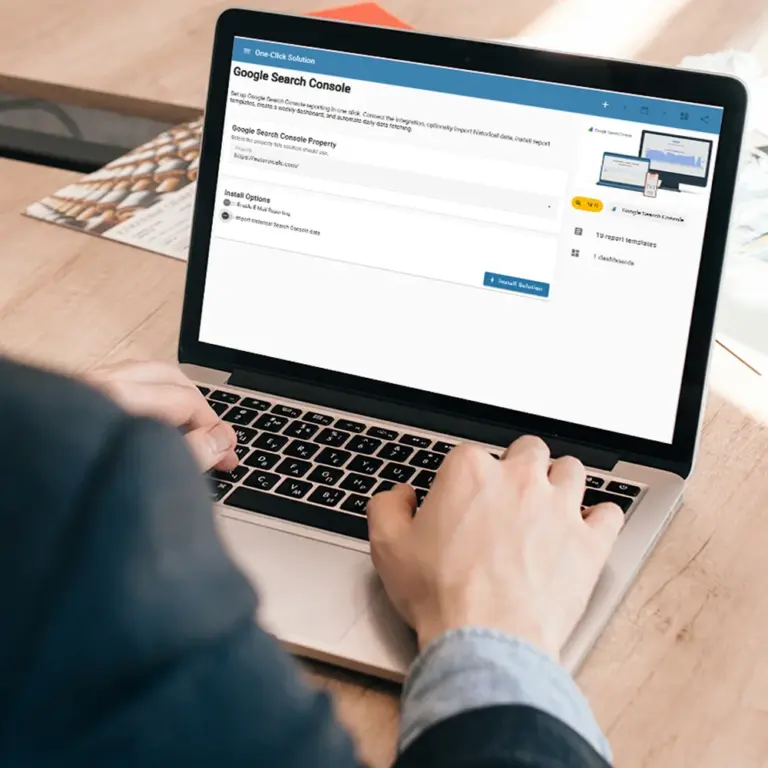
- Sections to organize report narratives.
- Charts to visualize trends and comparisons.
- Data tables for queries, pages, countries, devices, and other detailed records.
- KPI values to highlight totals, changes, and targets.
- Filters to explore SEO data from different angles.
Designed for Reusable Reporting
Create the report once, then reuse it as new data arrives. This makes recurring SEO reporting faster, more consistent, and easier to scale across clients or internal teams.
FAQs
What is a custom SEO report builder?
A custom SEO report builder lets you create SEO reports with your own sections, charts, data tables, KPI values, filters, goals, and dashboard widgets instead of using a fixed one-size-fits-all report format.
Why use custom SEO reports?
Custom SEO reports help you focus on the metrics and explanations that matter most to each client, team, or stakeholder. This makes the report clearer, more relevant, and easier to act on.
What can I include in a custom SEO report?
You can include report sections, charts, trend comparisons, data tables, KPI values, filters, goals, and widgets for SEO metrics such as queries, pages, countries, devices, rankings, clicks, and impressions.
Can custom SEO reports be reused?
Yes. You can build the report once and reuse the same structure as new data arrives, making recurring SEO reporting faster and more consistent.
Who should use a custom SEO report builder?
A custom SEO report builder is useful for SEO agencies, freelancers, consultants, marketing teams, and businesses that need flexible reporting for different clients, campaigns, or internal teams.
How do filters help in SEO reporting?
Filters help you explore SEO data from different angles, such as by query, landing page, country, device, campaign, or reporting period. This makes it easier to find trends and opportunities.
How is a custom dashboard better than a static report?
A custom dashboard can refresh with new data, show interactive views, and organize KPIs visually. A static report or spreadsheet usually needs more manual updating and formatting.