

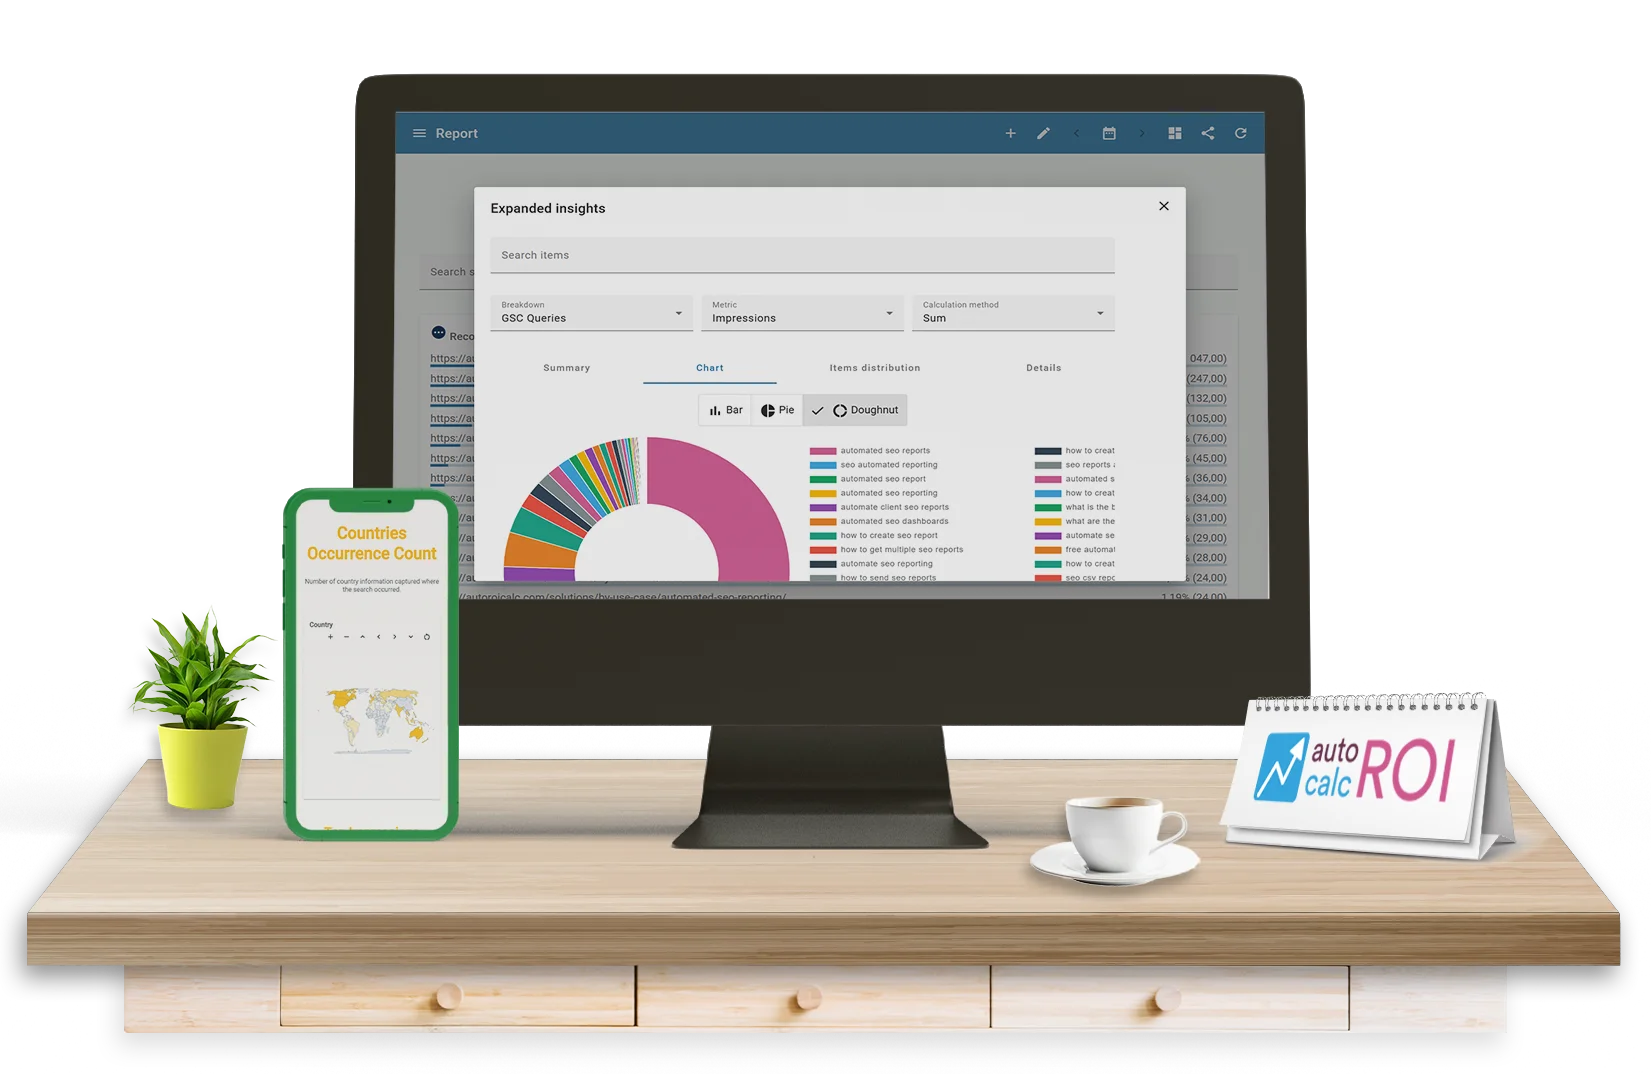
Turn SEO data into clear reports
Build dashboards that turn SEO data into clear charts, KPI values, tables, filters, and trends for teams, clients, and executives.
Track the SEO KPIs That Matter
- Search impressions, clicks, CTR, and average position.
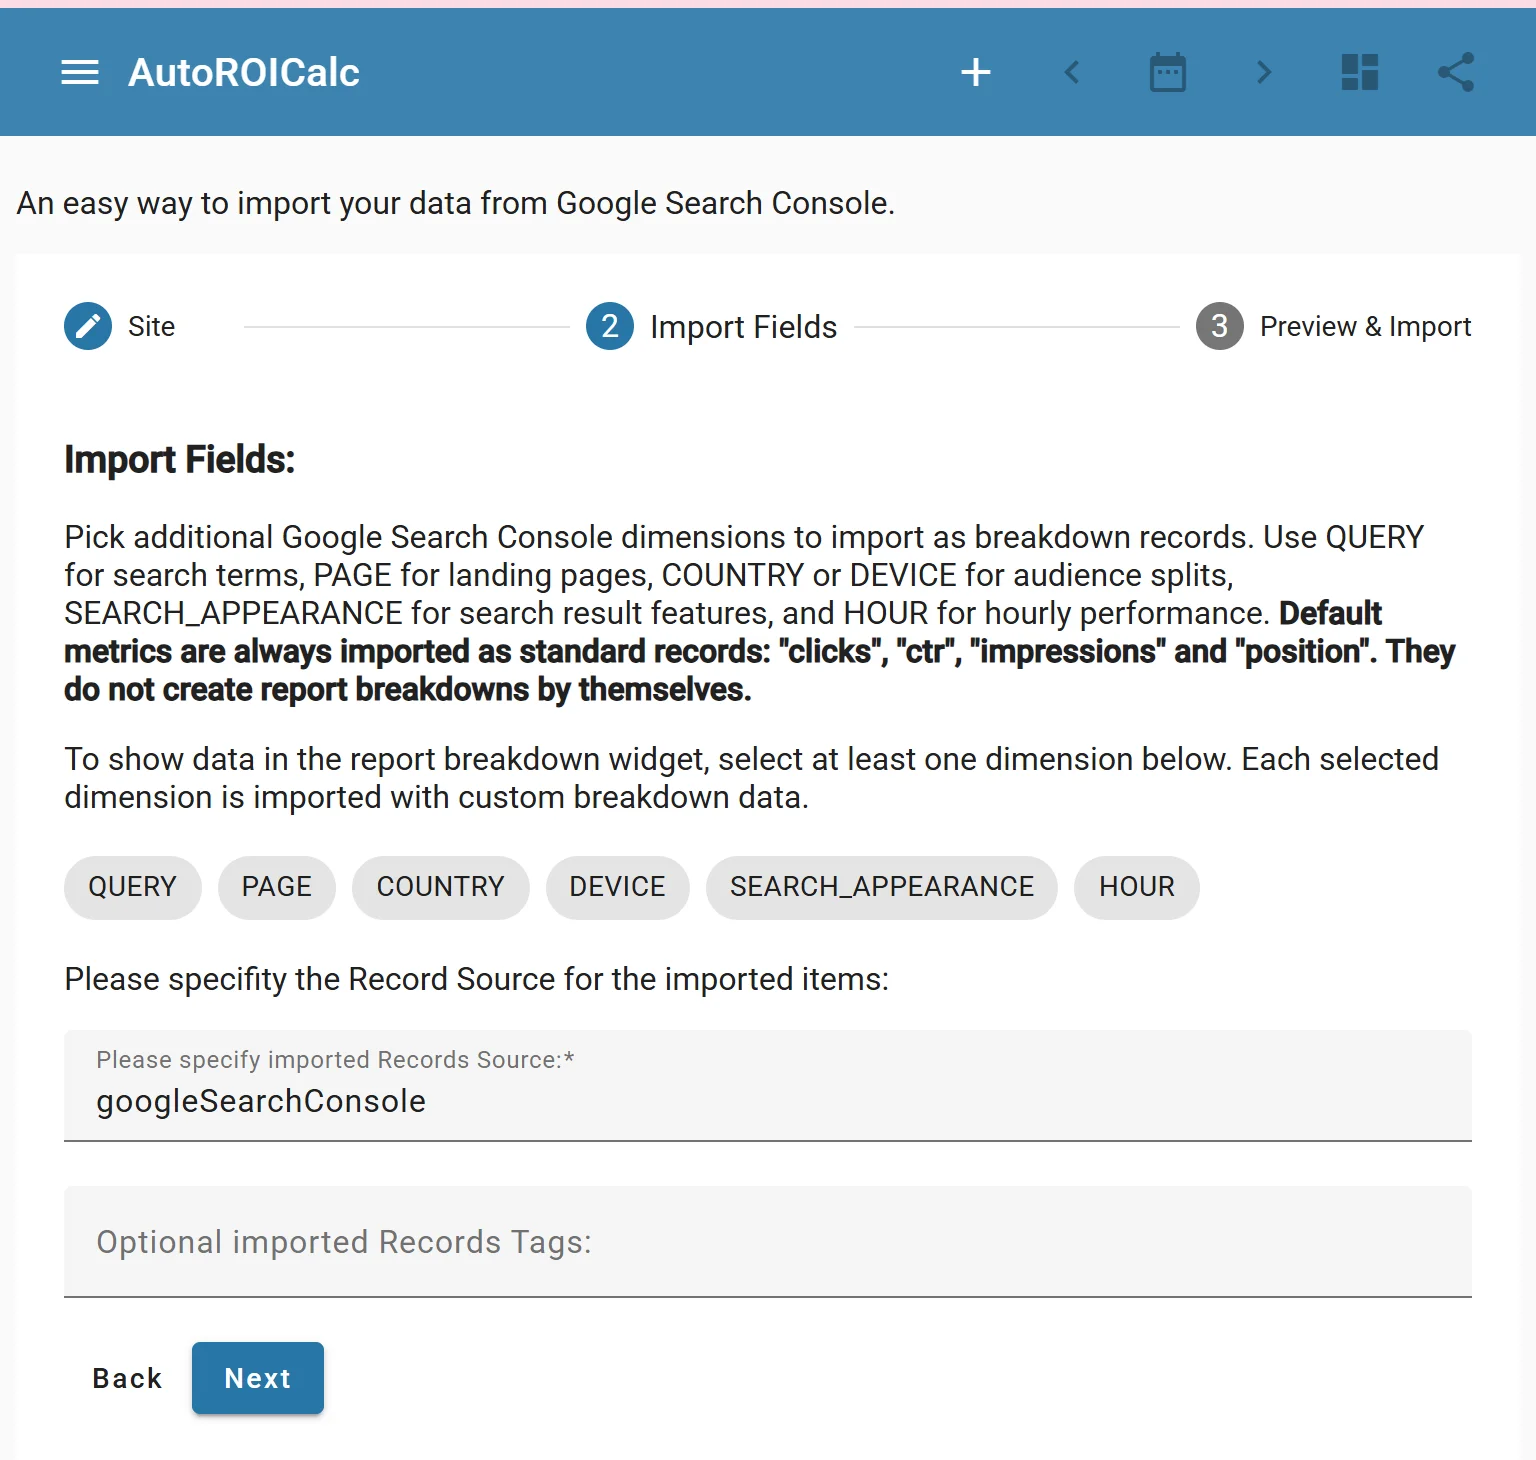
- Top queries and landing pages from Google Search Console.
- Traffic and engagement from GA4.
- Country, device, source, and campaign performance.
- Custom KPIs, goals, and performance targets.
Responsive Dashboards for Every Device

SEO dashboards should be easy to read on desktop, tablet, and mobile. AutoROICalc reports are responsive, so clients and teams can check performance without downloading files or opening spreadsheets.
Useful for Executives and Specialists
Executives need a fast view of results. SEO specialists need query, page, and trend detail. Custom dashboards let each audience see the level of reporting they need.
FAQs
What is an automated SEO dashboard?
An automated SEO dashboard turns search performance and marketing data into reusable charts, KPI values, tables, filters, and trends, so teams and clients can monitor SEO performance without manual reports or spreadsheet exports.
Which SEO KPIs can be tracked in a dashboard?
SEO dashboards can track impressions, clicks, CTR, average position, top queries, landing pages, traffic, engagement, country performance, device performance, campaign performance, custom goals, and performance targets.
Can Google Search Console data be included?
Yes. Google Search Console data can be used to show search impressions, clicks, CTR, average position, top queries, landing pages, countries, and devices.
Can GA4 data be added to SEO dashboards?
Yes. GA4 data can be added to give a broader view of website traffic, engagement, campaigns, and performance after visitors reach the site.
Are automated SEO dashboards useful for clients and executives?
Yes. Executives can use dashboards for a quick view of results, while clients and SEO specialists can review more detailed query, page, trend, and campaign performance data.
Do SEO dashboards work on mobile devices?
Yes. Responsive SEO dashboards can be viewed on desktop, tablet, and mobile, so clients and teams can check performance without downloading files or opening spreadsheets.
Why use an SEO dashboard instead of a spreadsheet?
An SEO dashboard is easier to read, share, refresh, and customize than a static spreadsheet. It can present important KPIs visually and help different audiences focus on the metrics that matter most.