

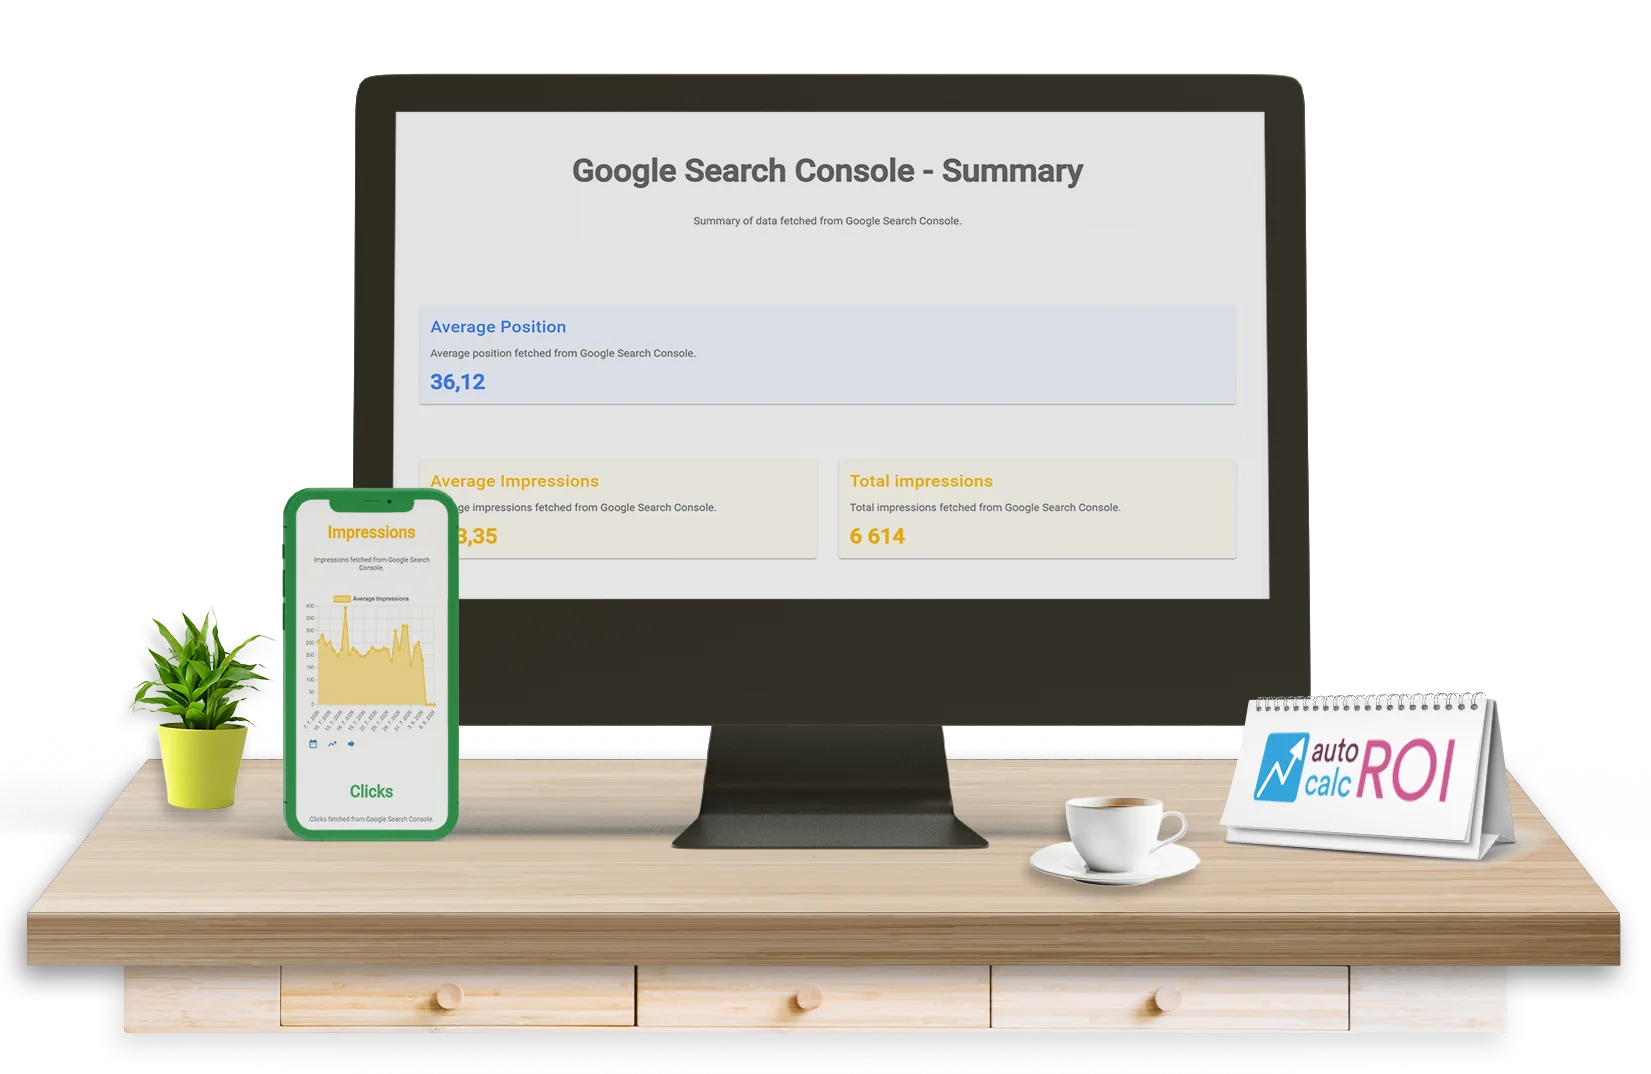
Turn Google Search Console data into automated SEO reports
…for clicks, impressions, average position, search queries, pages, countries, and devices.
What Can You Report from Search Console?
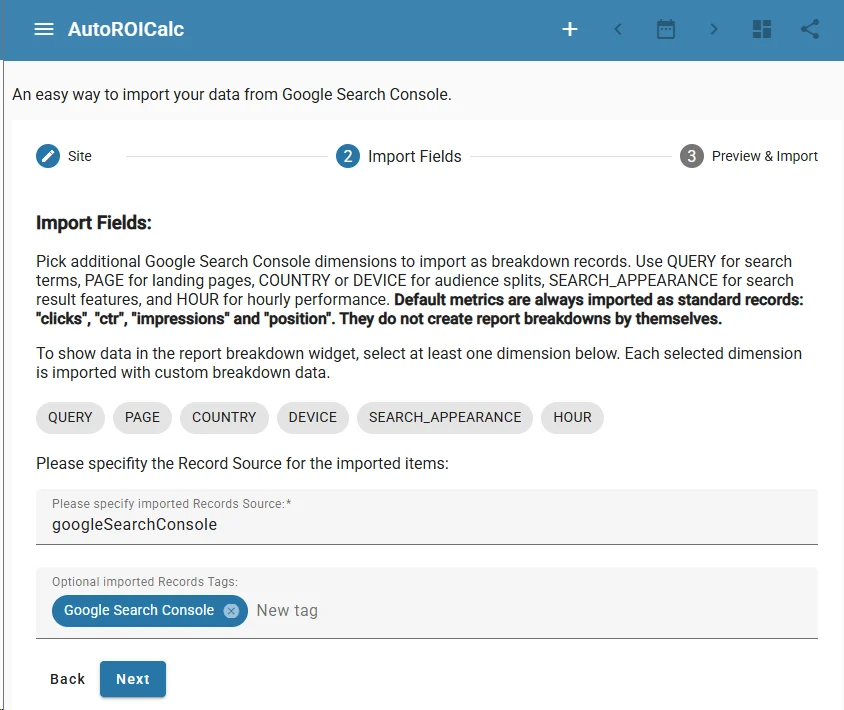
- Impressions – how often your pages appear in Google Search.
- Clicks – how often searchers visit your site from Google results.
- Average position – how your search visibility changes over time.
- Search queries – which keywords and topics drive visibility.
- Top pages, countries, and devices – where performance is coming from.
Why Automate Search Console Reporting?
Manual Search Console exports are useful once, but they become repetitive when you need regular updates for clients, managers, or internal teams. AutoROICalc connects to Google Search Console and turns recurring SEO data into reusable, scheduled, client-ready reports.
From Raw Data to Clear SEO Insights
Use automated charts, tables, KPI values, filters, and visual summaries to explain what changed in search performance without rebuilding the same report every week or month.
FAQs
What is an automated Google Search Console report?
An automated Google Search Console report pulls your Search Console data into a reusable report format, so you can track clicks, impressions, average position, queries, pages, countries, and devices without manually exporting data each time.
What Search Console metrics can I report on?
You can report on clicks, impressions, average position, search queries, top pages, countries, devices, and changes in organic search visibility over time.
Who are these SEO reports useful for?
They are useful for SEO agencies, consultants, marketing teams, website owners, and anyone who needs regular search performance updates for clients, managers, or internal reporting.
Can I use these reports for clients?
Yes. The reports are designed to be client-ready, making it easier to share recurring SEO performance updates without rebuilding the same charts and tables manually.
How often can the reports be updated?
Reports can be used for recurring SEO updates such as weekly, monthly, or campaign-based reporting, depending on how often you want to review Search Console performance.
Why automate Google Search Console reporting?
Automation saves time, reduces repetitive manual exports, and helps turn raw Search Console data into clearer insights using charts, tables, KPI values, filters, and visual summaries.